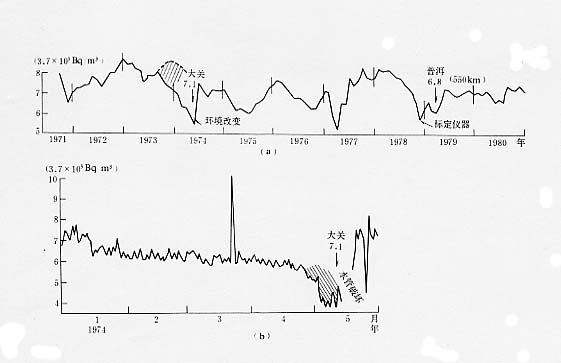
图20 西昌水氡月均值(a)、日均值(b)曲线
Fig.20 Curves of monthly mean values (a) and daily mean values
(b)of radon contents in water in Xichang station