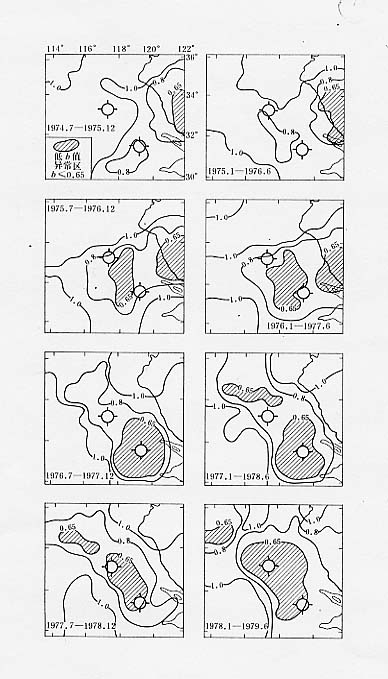
图
13 固镇5.0级地震前后b值分布图(
M
L
≥2.3,极大似然法)
Fig.13
b
-value curve before and after the Guzhen
M
5.0 earthquake