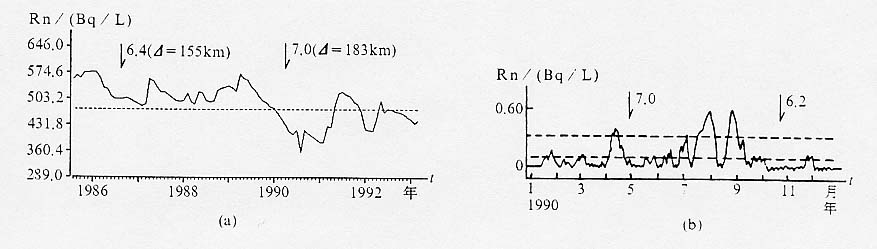
图37 共和7.0级地震前乐都水氡异常曲线
(a)月均值曲线;(b)日测值指数窗速率曲线
Fig. 37 Curves of radon amomalies in groundwater before
the M7.0 Gonghe earthquake at Ledu station
(a)Monthly mean value;
(b)Velocity curve of daily observation exponential window