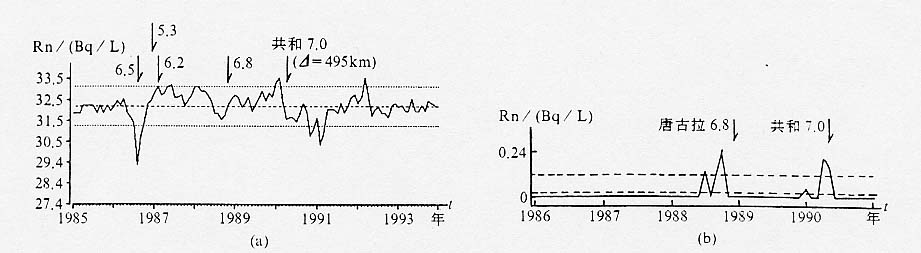
图42 共和7.0级地震前格尔木水氡异常曲线
(a)月均值曲线;(b)月均值自适应域值
Fig. 42 Curves of radon content in groundwater at Geermu station
before the M7.0 Gonghe earthquake
(a)Curve of monthly mean value;
(b)Curve of monthly mean self-adapting shreshold values