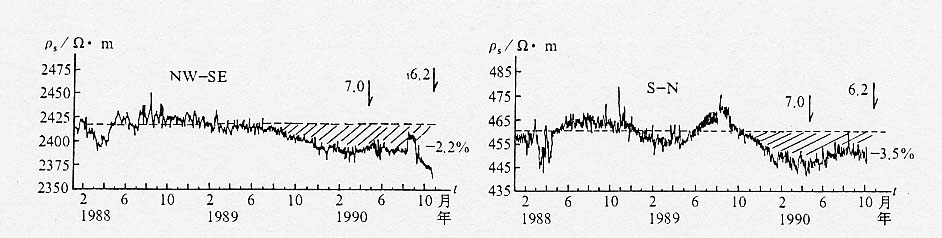
图49 共和7.0级地震前武都台地电阻率日均值曲线
Fig. 49 Curves of daily mean value of apparent resistivity at
Wudu station before the M7.0 Gonghe earthquake