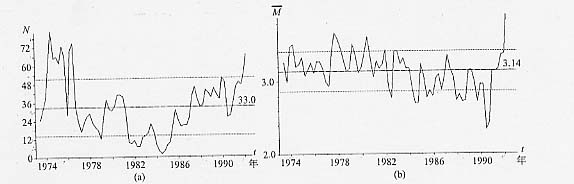
图10 南日岛5.2级地震前N-t曲线(a) 和缺震曲线(b)
Fig.10 N-t diagram of ML2.5~4.9 earthquakes (a) and curve of earthquake
deficiency before the MS5.2 Nanri island earthquake (b)