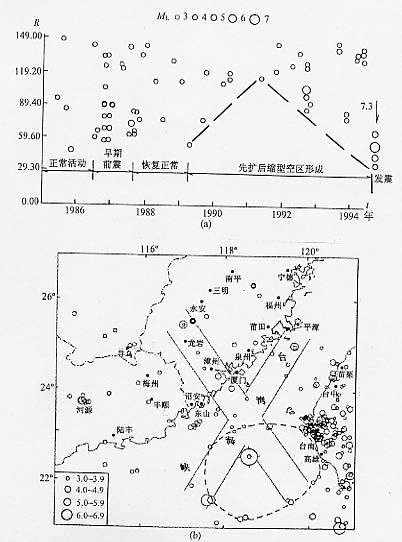
图13 1991年2月1日至1994年8月30日震中分布图[14] (ML≥3.0)
(a)空区形成过程R-t图; (b)孕育空区和地震条带图像
Fig.13 Epicentral distribution of earthquakes from Feb.1, 1991 to Aug.30, 1994