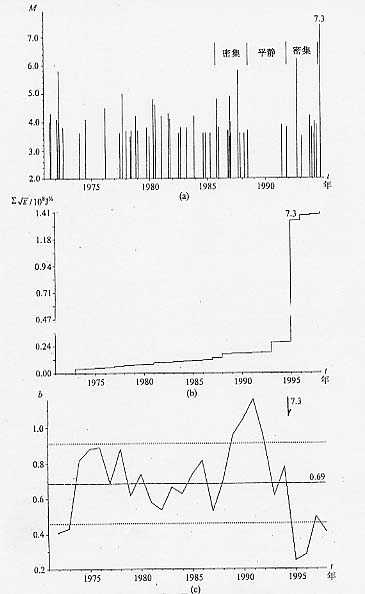
图14 震中周围地震活动参数随时间变化曲线
(21°30′~24°00′N,116°20′~119°20′E)
(a)M-t图(ML≥3.5); (b)∑根号E-t图;(c)b-t图
Fig.14 M-t diagram, ∑根号E-t curve and b-t curves around the epicentral area