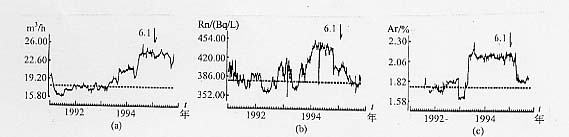
图26 台湾海峡7.3级地震前泉州台K+月均值变化曲线
Fig.26 Monthly mean value curve of K+ content in groundwater before the MS7.3
Taiwan Strait earthquake at Quanzhou station