图
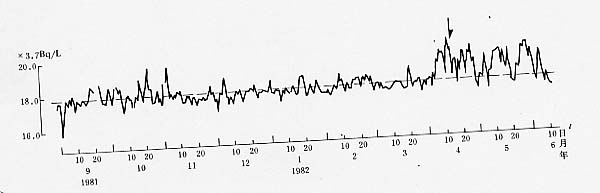
19 固原水氡日均值曲线 (Δ=110km)
Fig.19 Curve for daily mean value of radon content in water at Guyuan