图
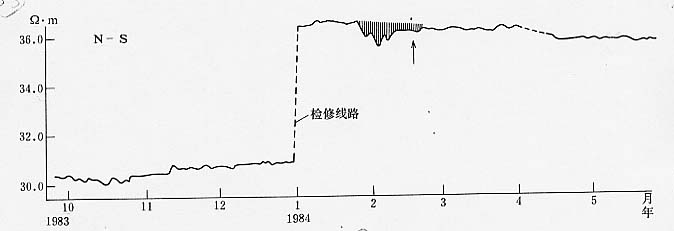
14 山丹台视电阻率日均值曲线图
Fig.14 Curve for daily mean value of apparent resistivity at Shandan station