图
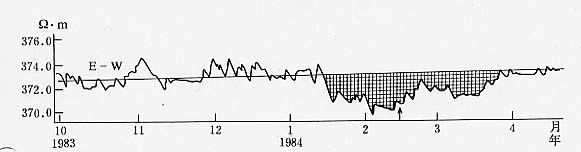
16 张掖台视电阻率日均值曲线图
Fig.16 Curve for daily mean value of apparent resistivity in Zhangyie station