图
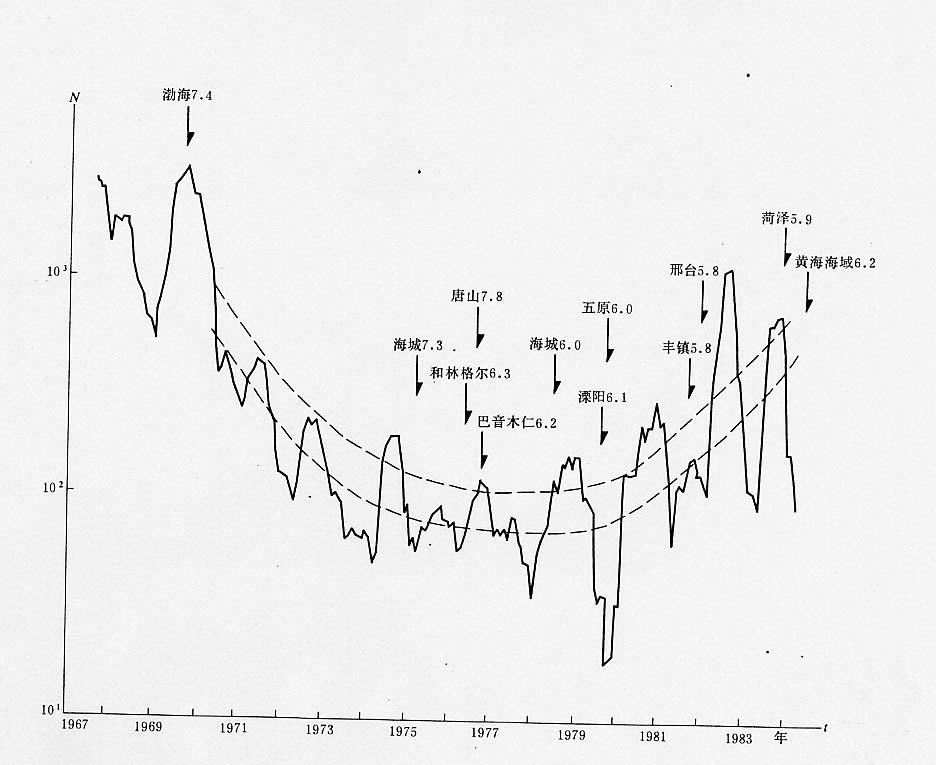
12 呼和浩特台视电阻率月均值曲线
Fig.12 Curve for monthly mean value of apparent resistivity at
Hohhot station