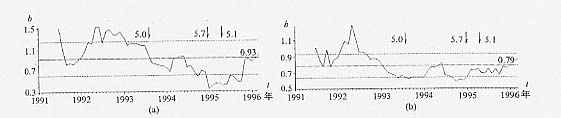
图17 沐川地区1991年1月~1996年2月间b值时间扫描曲线
(a)最小二乘法;(b)最大似然法(28°30′~29°30′N,103°00′~104°10′E)
Fig.17 b-value curves in Muchuan area from 1991 to 1996