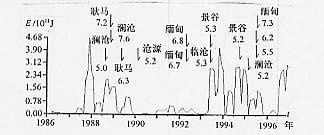
图13 震区周围ML3.5~4.9级地震月能量曲线图
Fig.13 Earthquake energy release per month for ML3.5―4.9 earthquakes
around the epicentral area