图
8
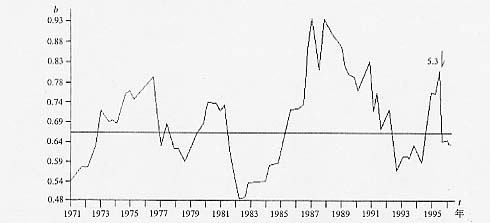
漳州―厦门地区
b
值异常曲线图
Fig.8 Variation of b
-
value in Zhangzhou and Xiamen area