图
14
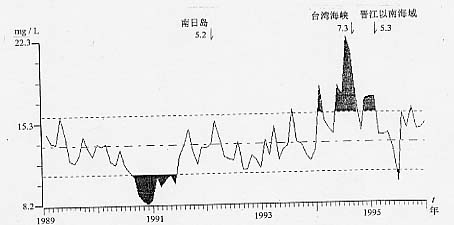
泉州
Ca
2+
月测值曲线图
Fig. 14 Monthly value of Ca
2+
content in groundwater at Quanzhou station