图
30
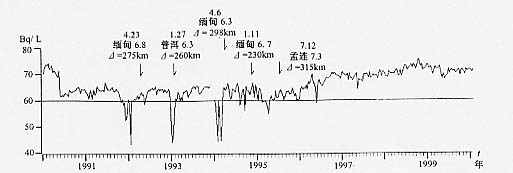
昌宁水氡旬均值曲线
Fig.30 Curve of 10-day mean value of radon content in groundwater at
Changning station