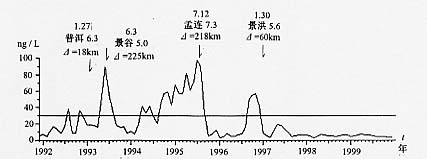
图
48
思茅水汞月均值曲线
Fig.48 Curve of monthly mean value of Hg content in groundwater
at Simao station