图
55
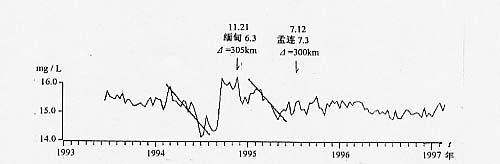
施甸镁离子旬均值曲线
Fig.55 Curve of 10-day mean value of Mg
2+
content in groundwater at
Shidian station