图
57
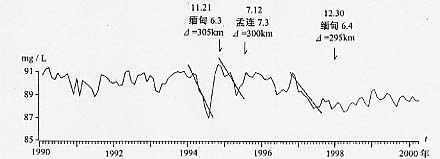
施甸钙离子月均值曲线
Fig.57 Curve of monthly mean value of Ca
2+
content in groundwater at
Shidian station