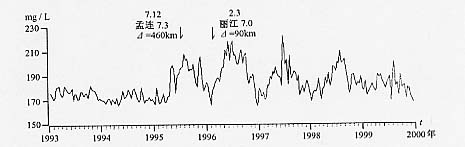
图
65
洱源二氧化碳月均值曲线
Fig.65 Curve of monthly mean value of CO
2
content in groundwater
at Eryaun station