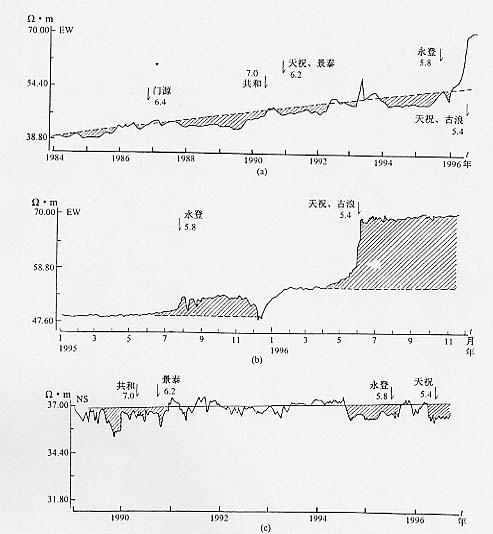
图15 武威地电阻率5日均值(a、c)与日均值(b)曲线
Fig.15 Curve of 5-day (a , c)and daily (b)mean value of apparent
resistivity at Wuwei station