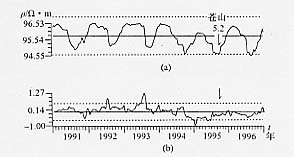
图25 新沂台视电阻率曲线(EW向)
(a)10日均值;(b)差值曲线
Fig.25 Curves of 10-day mean value(a)and difference value(b)of apparent
resistivity(EW) at Xinyi station