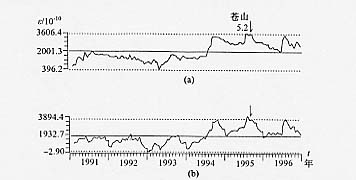
图26 徐州体应变曲线图
(a)观测曲线图(旬均值);(b)距平曲线(全部样本统计)
Fig.26 Curves of 10-day mean value(a)and departure value(b)
of volumetric strain at Xuzhou station