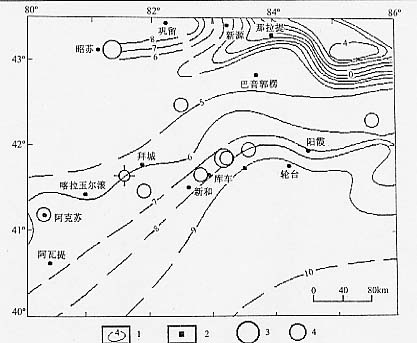
图2 区域垂直形变速率图(1951~1990)
1.垂直形变速率等值线(mm/a);2.场地;3.7.0≤M≤7.9;4.6.0≤M≤6.9
Fig.2 The rate map of regional vertical deformation (1951~1990)