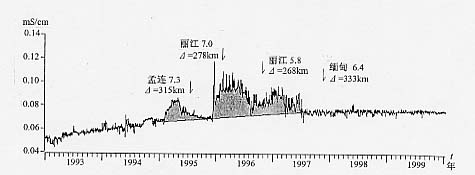
图
43
昌宁电导率日均值曲线
Fig.43 Curve of daily mean value of conductivity of groundwater
at Changning station