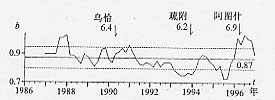
图13 震中周围地区1986年以来b值时序曲线(MS≥2.5)
Fig.13 b-value curve of MS≥2.5 earthquakes around the epicenter since 1986