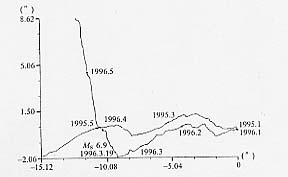
图19 阿图什地倾斜1996年1~5月日均值矢量合成图
Fig.19 Composite vector map of daily mean value of tilt at Atushi station
from Jan. to May in 1996