图
14
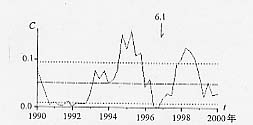
震中附近
C
值时序曲线
Fig.14 C
-
value curve of earthquakes around the epicentral area