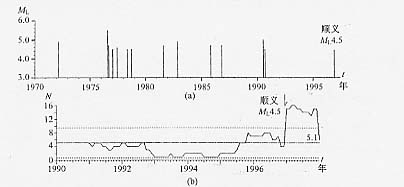
图12 京津地区4.5级以上地震M-t(a)和ML≥3.0地震频度图(b)
Fig.12 M-t diagram(ML≥4.5,a)and curve of earthquake frequency(ML≥3.0,b)
before the Shunyi earthquake in Beijing and Tianjin area