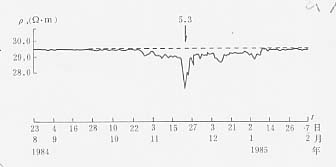
图20 银川台视电阻率日均值变化曲线2)
Fig.20 Variation curve for daily mean value of apparent
resistivity at Yinchuan station