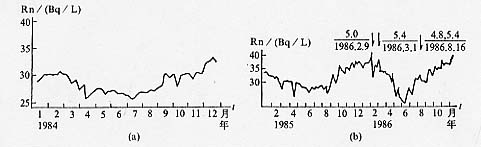
图 14 绥化台水氡五日均值曲线图(据文献[11])
(a)1984年正常期;(b)1985~1986年
Fig.14 Curve of daily mean values of
water radon content at Suihua
station