图
15
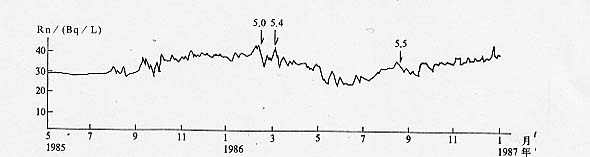
绥化台水氡日均值曲线图
Fig.15
Curve of daily mean values of
water radon content at Suihua
station