图
17
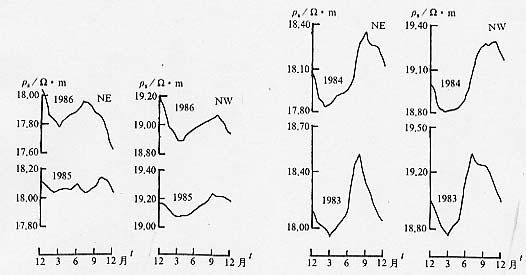
绥化台地电阻率月均值曲线图
Fig.17
Curve of monthly mean values of
apparent resistivity at Suihua
station