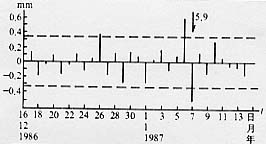
图12 库尔勒台(Δ=400 km)水准测量S-N边日变化曲线
(1986.12.16~1987.1.13)
Fig.12 Curve of daily variation of levelling (S-N side) at
Kuerle station