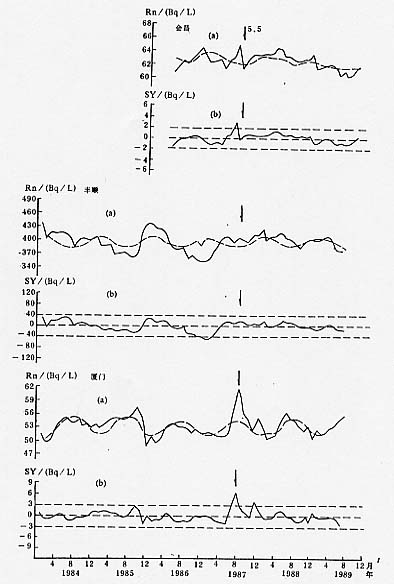
图21 寻乌5.5级地震前水氡月均值变化曲线图
图注:三组图中的(a)实测线和回归曲线;(b)表示余差值曲线
Fig.21 Monthly mean value curves of radon content in groundwater
before the MS5.5 Xunwu earthquake