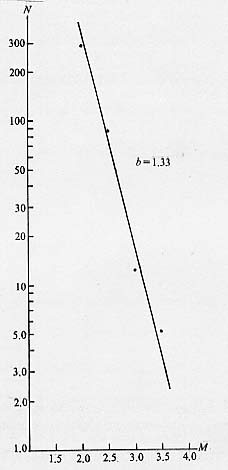
图5 宁蒗5.5级地震余震序列b值曲线
(1988.1.10~1988.4.20,ML≥1.8)
Fig.5 b-value curve for the aftershocks sequence of the
MS5.5 Ninglang earthquake