图
20
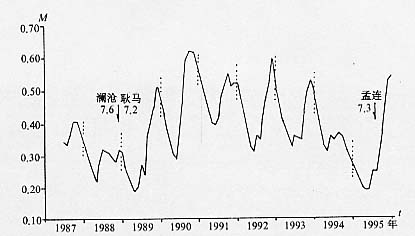
施甸水位月均值曲线
Fig.20
Curve of monthly mean value of water level in
Shidian