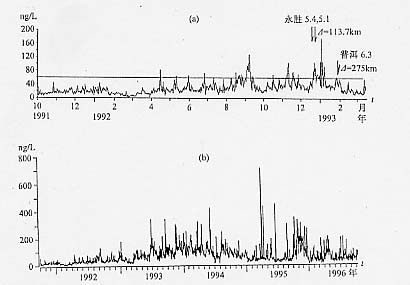
图29 弥渡水汞日均值曲线
(a)1991年10月至1993年3月;(b)1991年9月至1996年9月
Fig.29 Curve of daily mean value of Hg content in groundwater
in Midu station