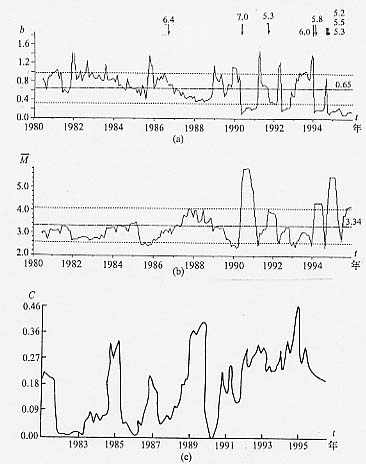
图15 青海东部地区地震活动性参数时间扫描曲线(ML≥2.0)
(a)b值曲线;(b)缺震曲线;(c)空间集中度曲线6)
Fig.15 Curves of seismic activity anomalies in the east Qinghai